What makes a digital game market?
Studios, platforms and players are connected by different relationships. A market map becomes useful when those relationships are named.
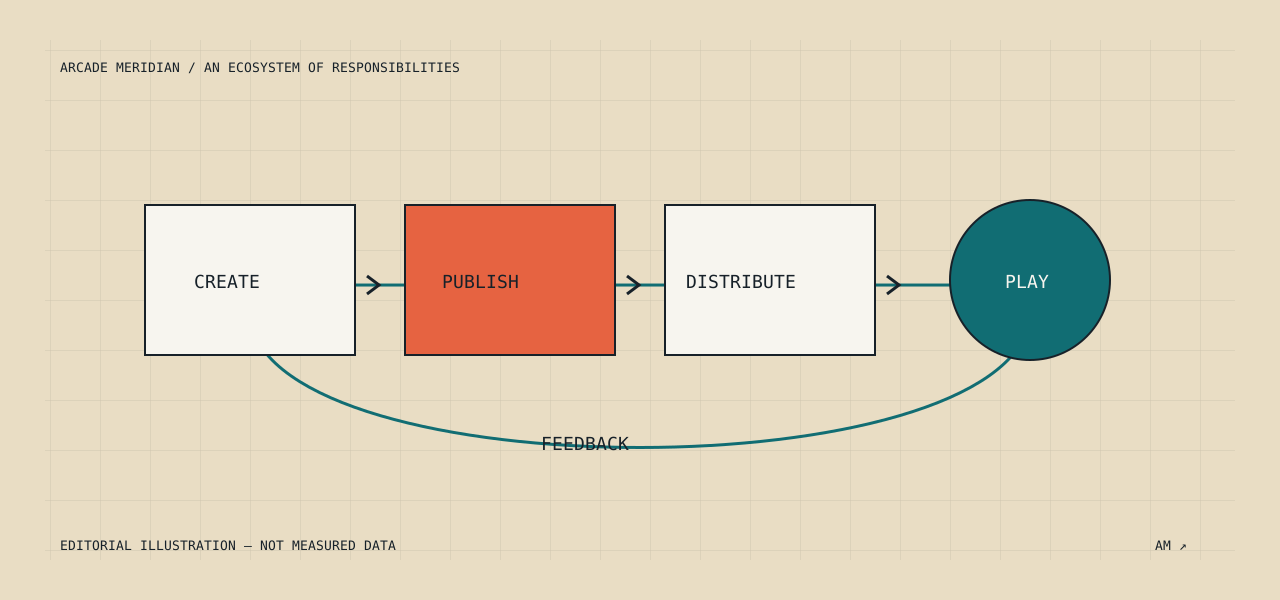
A list of companies is not yet a market map
Put a studio, a storefront and a player community on the same diagram and it can look as though the industry has been explained. Yet the lines between those labels carry most of the meaning. Who pays whom? Who owns the release decision? Which organization can change a broken build? Which relationship is known, and which is merely assumed because two names appear in the same search result?
For a small editorial project, the first useful map is deliberately incomplete. It establishes a few named examples, describes the type of evidence available and leaves blank spaces visible. The aim is to help a reader investigate an ecosystem without borrowing the confidence of a market report that has not been conducted.
Follow four different flows
Our framework separates creative work, distribution, money and feedback. Creative work includes design, writing, art and implementation. Distribution concerns the route through which a playable build reaches a device. Money may move through sales, funding or service contracts. Feedback can arrive through support, playtesting and communities. A single arrow labelled partnership cannot describe all four.
For example, a studio’s own catalogue is evidence of the work it presents. A store listing can establish that a release is offered through a particular channel at a particular time. Neither source, alone, reveals the financial terms between the parties. The map should preserve that distinction rather than imply that a public association is a verified contract.
| Relationship | A useful question | What public evidence may miss |
|---|---|---|
| Studio → publisher | Who makes the final release decision? | Private responsibilities and terms |
| Publisher → platform | Which build and listing are offered? | Review history and private agreements |
| Platform → player | What must happen before play begins? | Individual device and access conditions |
| Player → studio | How does a problem reach the team? | Unreported failures and silent abandonment |
Start with examples that can be checked
Maliyo and Free Lives provide two first-party starting points for examining creative work in Lagos and Cape Town. Their catalogues establish named examples. They do not establish a representative sample, the location of their customers or the total value of development activity in either country.
This limitation is productive. It encourages a dossier to ask a narrow question: what can this particular example teach us about the kinds of work a studio presents? It discourages a much larger, unsupported claim about what an entire country produces or enjoys. Our Nigeria and South Africa dossiers follow that narrower approach.
Put the player into the diagram
A release exists in a catalogue, but play happens under concrete conditions. A player has a device, a language preference, time, storage and a way of finding the work. The person may be a purchaser, a trial user, a spectator or a community organizer. Those roles should not be collapsed into a single commercial label.
An invented cooperative puzzle game makes the distinction clear. One person might discover it through a friend, another might install a trial, and a third might only watch a stream. Counting all three as equivalent demand would hide the different relationships. A research brief should decide what it means by audience before collecting observations, and avoid changing that definition when a larger number becomes available.
Distribution mechanisms are not demand forecasts
Steamworks’ demo documentation supplies an example of a mechanism that lets a team offer a trial. It does not tell us how many people in a given place will try it. Similarly, ITU’s connectivity reporting addresses connectivity indicators rather than game consumption. A map becomes misleading when an available mechanism or a broad infrastructure statistic is used as a proxy for demand without a defensible bridge.
The editorial remedy is to write the bridge down as a question. What observation would connect access to an actual session? Which sample would show that a language choice matters? How would a study account for people who never reach installation? These questions can guide research even when the answers are not yet available.
Keep uncertainty on the page
For each entry, record the source, the date it was read and what it cannot support. First-party evidence can be strong for a narrow fact and weak for a broader conclusion. A company may accurately list its own games while naturally presenting itself favorably. Source type is therefore part of the record, not a substitute for judgment.
The Signals Atlas implements this approach with individual qualitative observations and explicit caveats. It is a reading aid, not a complete directory or a ranking. New evidence should be added by extending the map carefully, not by filling every blank space with a plausible name. The most useful market map is one that tells the reader exactly where its knowledge ends.
Sources & boundaries
Source review: . Undated sources are not assigned an invented publication date.
- Maliyo Games: Studio and game catalogue ↗
A studio catalogue establishes examples, not national revenue, employment or audience share.
Publication and review dates
Source publication: Undated. Source accessed and reviewed: 2026-11-17. Publisher: Maliyo Games.
- Free Lives: Cape Town studio and catalogue ↗
A single studio is not a representative sample of South African development.
Publication and review dates
Source publication: Undated. Source accessed and reviewed: 2026-11-17. Publisher: Free Lives.
- Valve / Steamworks: Demos ↗
Availability of demos does not establish discoverability, conversion or demand.
Publication and review dates
Source publication: Undated. Source accessed and reviewed: 2026-11-17. Publisher: Valve / Steamworks.
- International Telecommunication Union: Facts and Figures 2026: release note ↗
Connectivity indicators are not counts of players or estimates of a game market.
Publication and review dates
Source publication: 2026-11-03. Source accessed and reviewed: 2026-11-17. Publisher: International Telecommunication Union.
Original desk analysis; no interviews or field testing claimed. Corrections policy · Inspect Signals Atlas