Two connectivity figures do not make a games market
Read Nigerian connection statistics beside a South African household survey without confusing units, dates or the people a game might reach.
A comparison can be useful without a winner
Imagine an editor has two tabs open: Nigeria’s telecommunications statistics and a South African household survey release. Both concern access to communications. It is tempting to place their most prominent numbers in adjoining columns and announce which country offers the larger opportunity for a mobile game. The visual symmetry would arrive before the evidence.
The useful comparison begins elsewhere. What is being counted? Who supplies the observation? Which period does it describe? Does it measure a connection, a household, a person, or an actual session? Our Evidence Atlas puts sources beside one another without turning different units into a ranking. This article explains how to read that comparison and how to record the work still missing.
First tab: an administrative connection series
The Nigerian Communications Commission’s industry statistics say the series is compiled from operators’ submissions at the reporting cut-off. Its teledensity definition uses active telephone connections per 100 inhabitants. That is a concrete administrative measure, not a directly observed count of unique players.
Our inference is limited: the label “connections” must survive any later chart or sentence. An editor cannot silently replace it with “people who play games.” Nor does an active telephone connection establish a suitable device, available storage, an affordable installation or an interest in a particular title. Those are separate questions, not adjustments that can be guessed from the same table.
Inspect the Nigeria source and its boundary
Publisher: Nigerian Communications Commission. Source: Industry Statistics, collection note and teledensity definition. Publication date: undated rolling page. Accessed and reviewed: 17 November 2026. We use its definition, not an extracted national player total. A reporting period is not the publication date of the web page.
Second tab: a historical household snapshot
The official release for South Africa’s General Household Survey 2024, issued on 27 May 2025, reports household Internet access of 82.1% through any means and 17.4% through fixed access at home. These are explicitly 2024 household measures, not percentages of individual players.
This source is retained as a dated example. It is not presented as the latest survey: a newer edition exists, but its full report was not directly retrievable during this review. The comparison does not need a claim of freshness to teach the distinction between a household measure and a connection series. It does need the historical label to remain visible.
The two South African percentages should not be added. A household with fixed access can also have another means of access. The release does not give us a mutually exclusive split of game players. A headline that turns both categories into separate audiences would create people through arithmetic rather than observation.
Inspect the household source and its boundary
Publisher: Statistics South Africa, through the South African Government portal. Source: General Household Survey 2024 release. Published: 27 May 2025. Accessed and reviewed: 17 November 2026. This is a historical summary, not a device-performance study, player census or current market estimate.
A small counterexample exposes the mistake
Consider a fictional household of four people. Two share a phone, one has two subscriptions, and one has no personal access. This is an invented teaching example, not a claim about either country. A connection count, a household-access indicator and a person-level question could all describe that household differently.
Now add a specific game. It may require a newer operating system, a particular input method or a download that someone chooses not to make. Even a careful person-level Internet measure would still not tell us who installed it. Finally, a completed installation does not establish a returning player or a paying customer. Each step changes the object being counted.
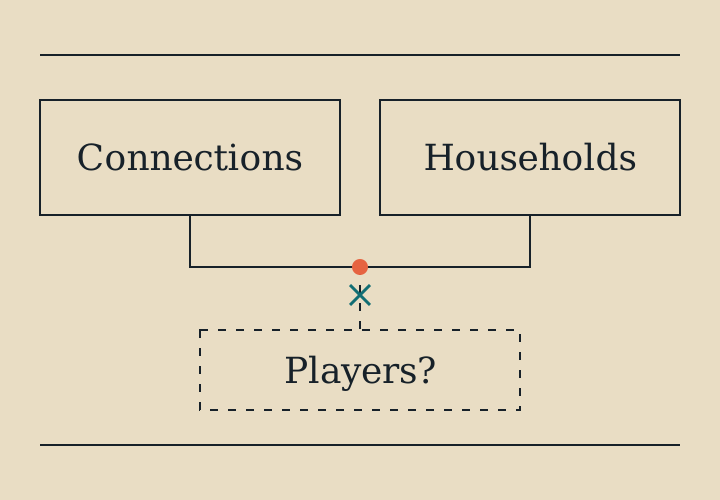
This is why the empty space in our illustration matters. The diagram does not imply a conversion rate between connections and play. It marks the absence of the title-level study that would be needed to connect them.
Build a comparison record before building a chart
A useful research note can be short. Give each candidate number six accompanying fields:
- Unit: connection, household, individual, device, installation or session.
- Population: the set the statement is intended to describe, including exclusions.
- Period: the reference year or reporting interval, kept separate from the access date.
- Collection: operator submission, survey response, measurement or platform documentation.
- Definition: the precise activity or condition the source calls access or use.
- Allowed conclusion: one sentence that does not change the unit or widen the population.
Then add a seventh field: missing evidence. For a game-release decision it might include a defined audience, device tests or observed completion of the first session. Leaving that field open is more useful than filling it with an unrelated regional average.
The ITU’s 2026 release reinforces the need to distinguish use, coverage, subscriptions and affordability. We do not use its regional or global figures to supply country-specific gaps. Its role here is conceptual context, not a substitute dataset.
What a developer can do next
A small team does not need to commission a national market study before testing an installation flow. It can define a much narrower task: can an invited participant complete a first session on a documented build and device under a stated connection condition? That experiment can expose a reproducible defect. It cannot estimate how many people nationwide encounter it.
Record both kinds of evidence without merging them. Keep the population-level source in the research note. Keep the build, conditions and observed task in a separate test record. Explain the decision connecting them as an editorial or product judgment. If the judgment is that an interruption needs a recovery path, test the recovery path; do not claim a national prevalence from a few rehearsals.
Our Nigeria dossier and South Africa dossier still begin with narrow creative examples. The new connectivity records add different evidence, not a licence to generalize those examples. Download a filtered list from the atlas when you need the citations and caveats together. A useful comparison leaves the reader with better questions and a traceable record, even when it cannot name a winning market.
Sources & boundaries
Source review: . Undated sources are not assigned an invented publication date.
- Nigerian Communications Commission: Industry Statistics: collection note and subscriber definitions ↗
Connections are not unique people or players. This rolling source has a reporting cut-off and an undated publication record; no game-audience estimate follows.
Publication and review dates
Source publication: Undated. Source accessed and reviewed: 2026-11-17. Publisher: Nigerian Communications Commission.
- Statistics South Africa: General Household Survey 2024: official release ↗
A 2024 historical snapshot, not the latest edition or an individual/player measure. Categories overlap; this summary supplies no game-performance observation.
Publication and review dates
Source publication: 2025-05-27. Source accessed and reviewed: 2026-11-17. Publisher: Statistics South Africa.
- International Telecommunication Union: Facts and Figures 2026: release note ↗
Connectivity indicators are not counts of players or estimates of a game market.
Publication and review dates
Source publication: 2026-11-03. Source accessed and reviewed: 2026-11-17. Publisher: International Telecommunication Union.
Individual claim records: Count the connections before naming the audience · A household access measure keeps its household unit
Continue the investigation
Original desk analysis; no interviews or field testing claimed. Corrections policy · Inspect Signals Atlas